Module 2 Formstorming
Weekly Activity Template
Edith Yago — Sound Visualization and Interactive Media
Project 2
Module 2
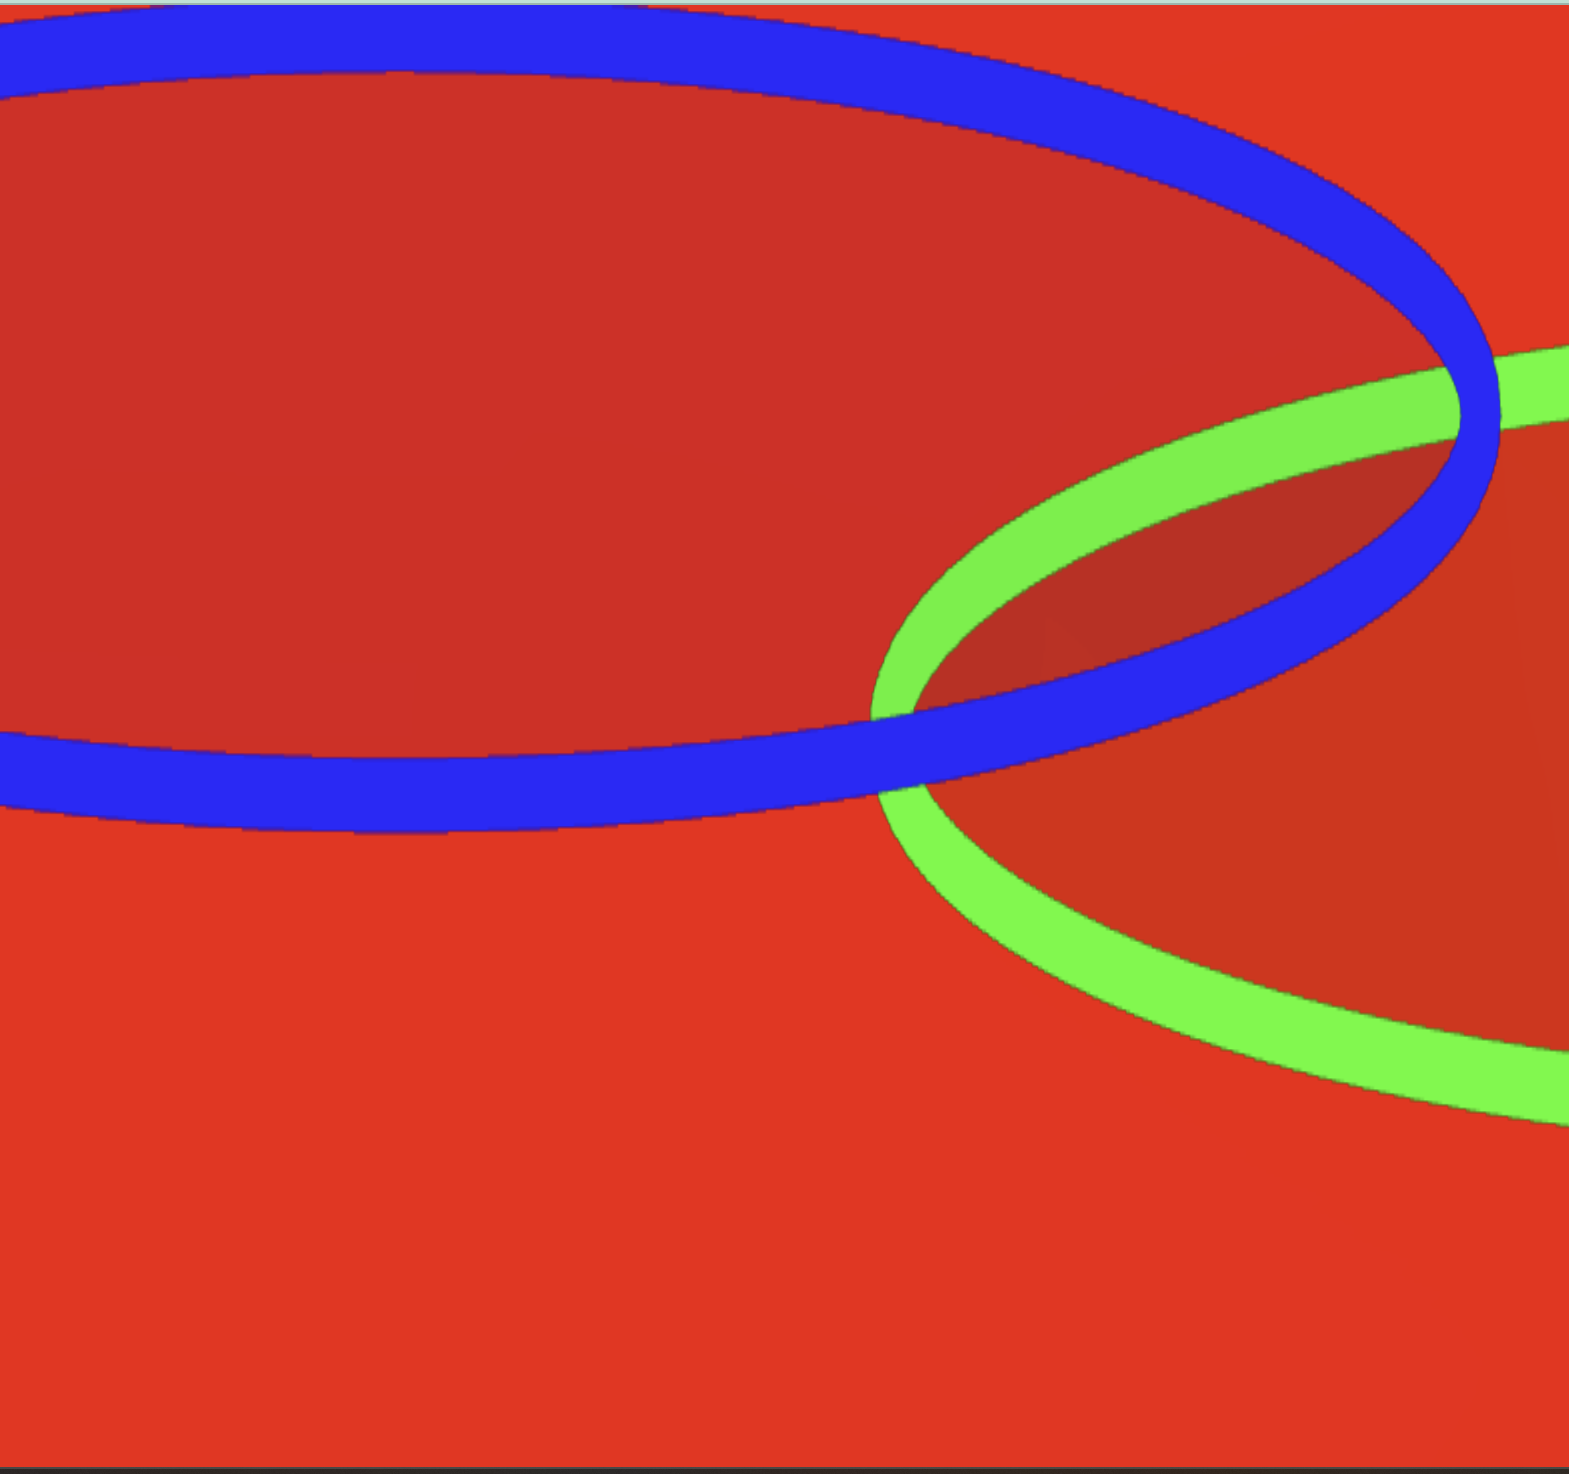
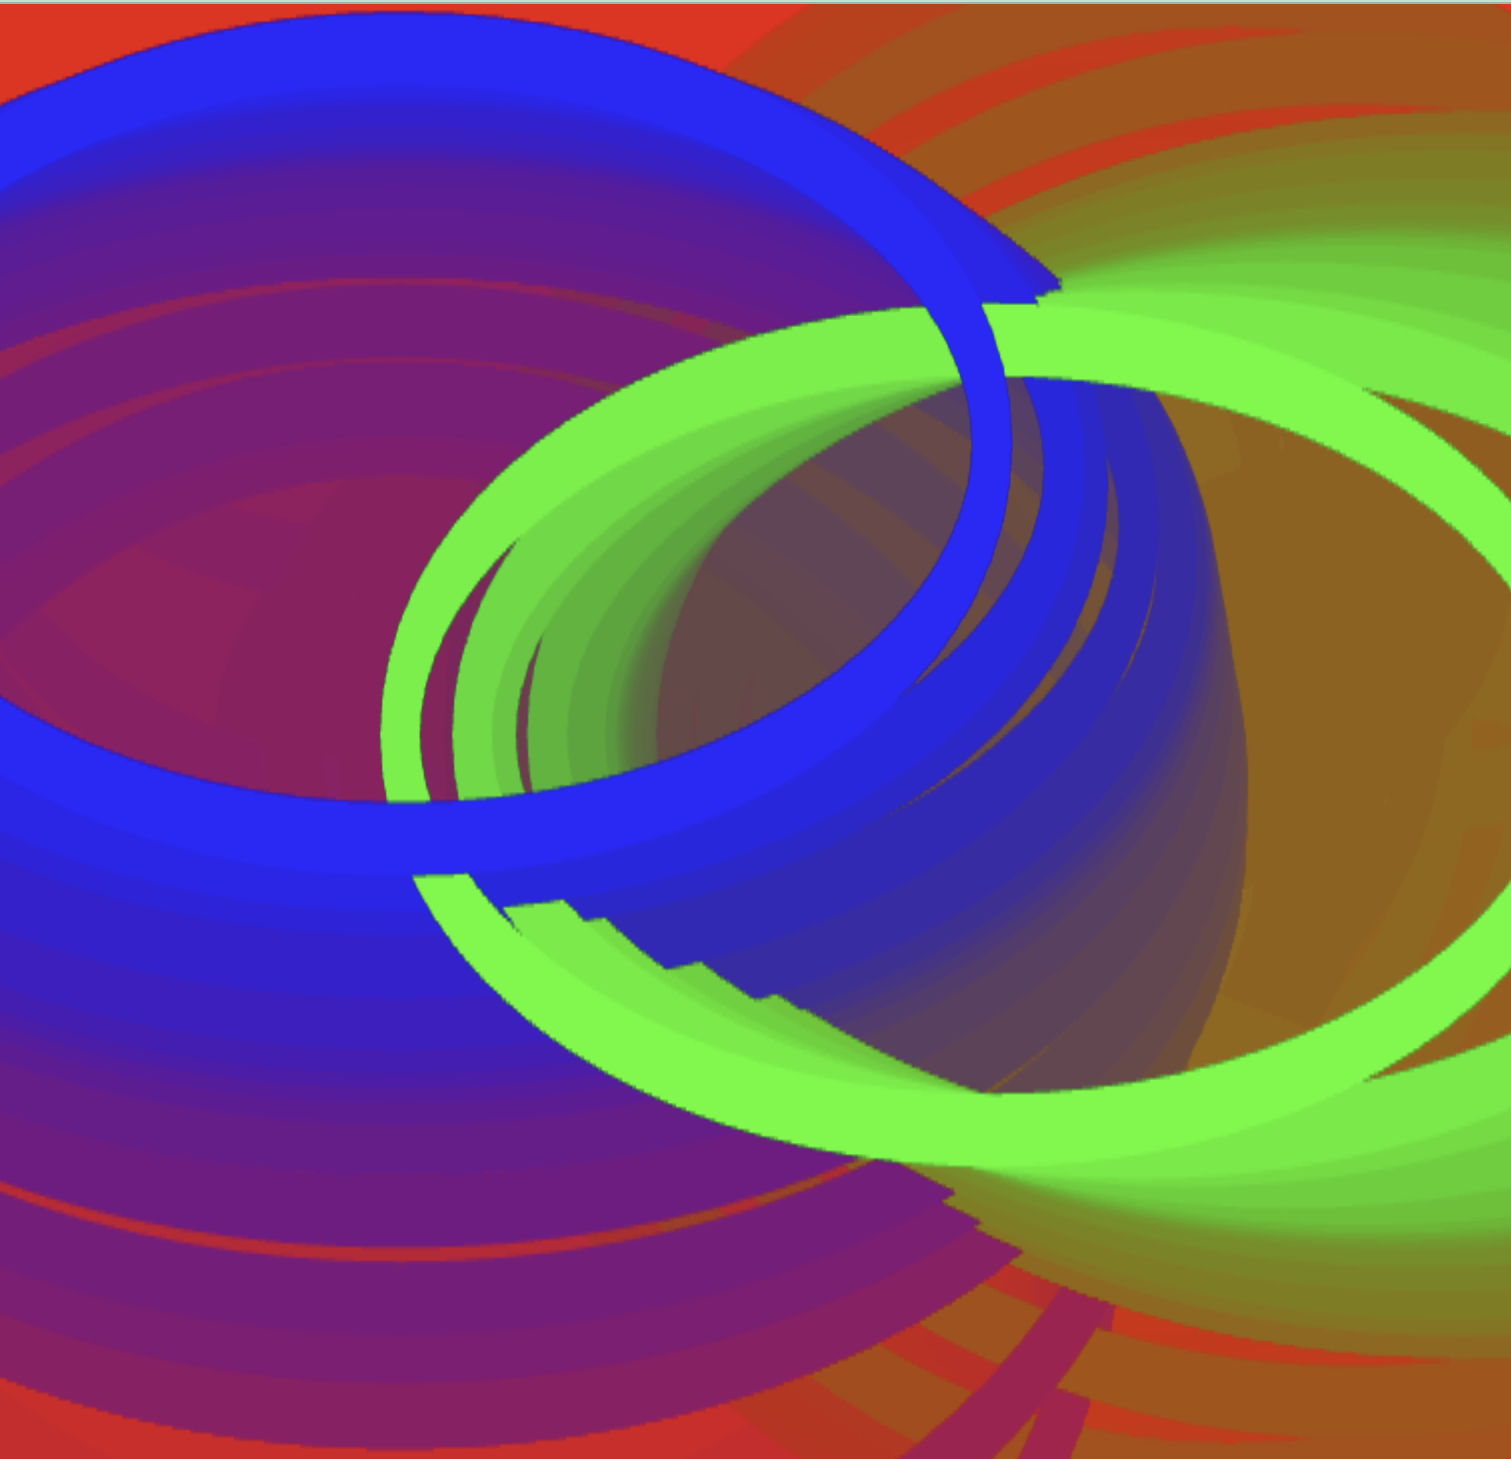
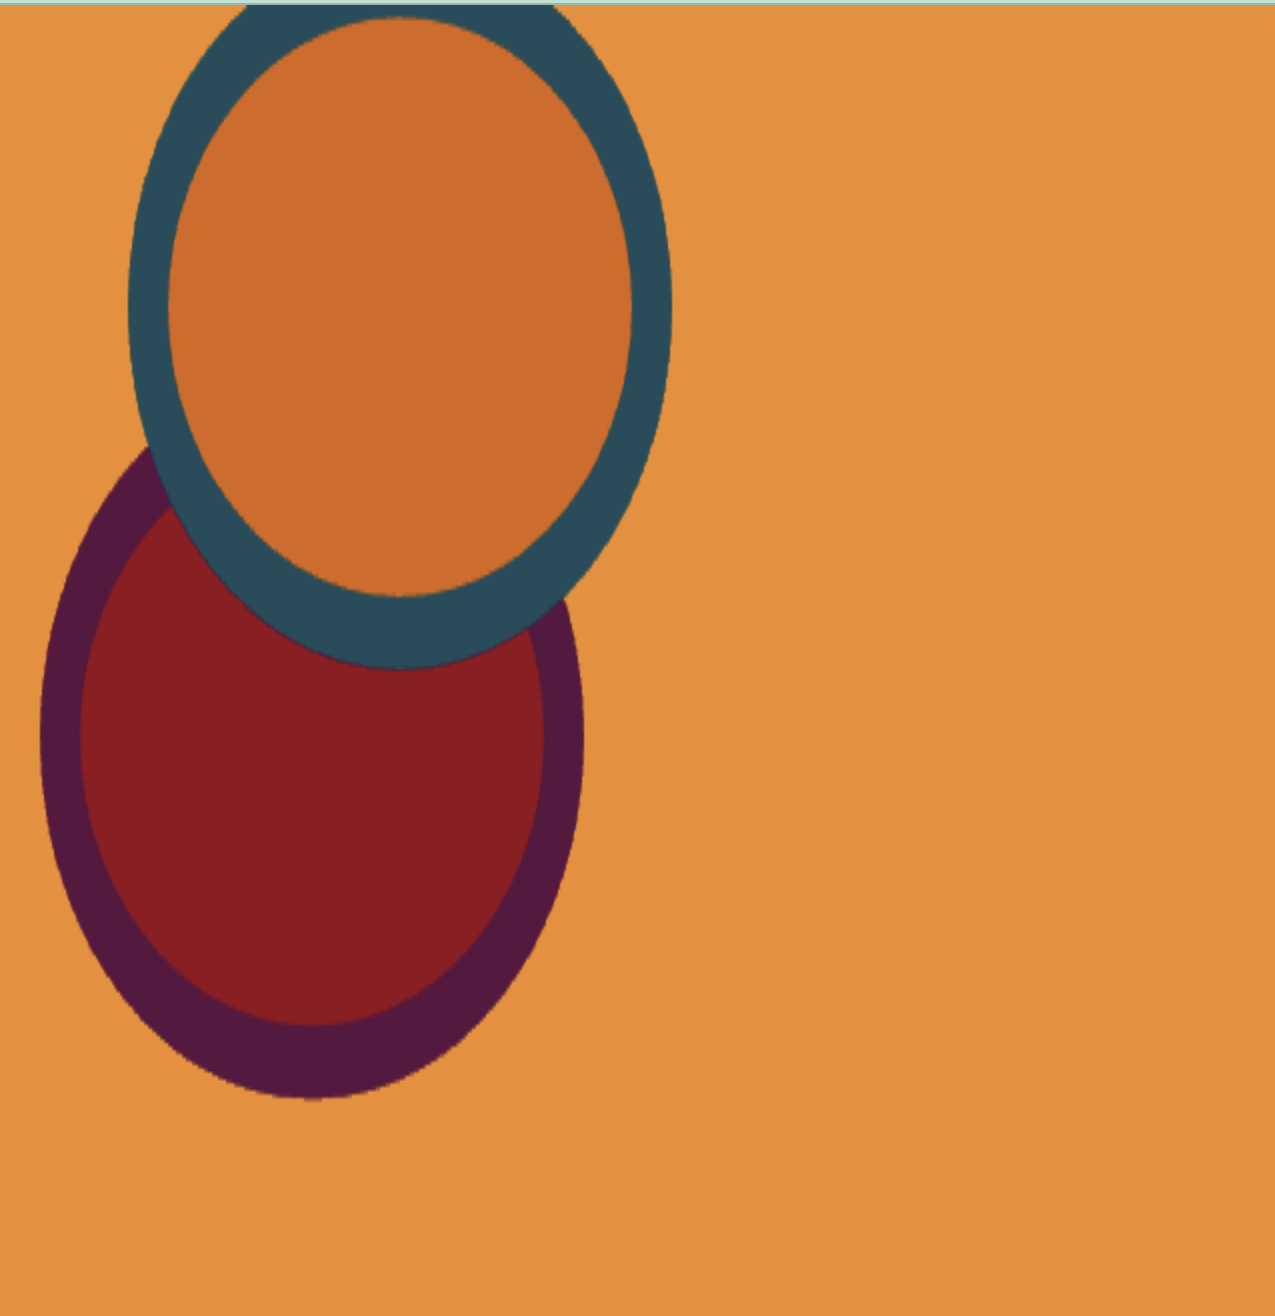
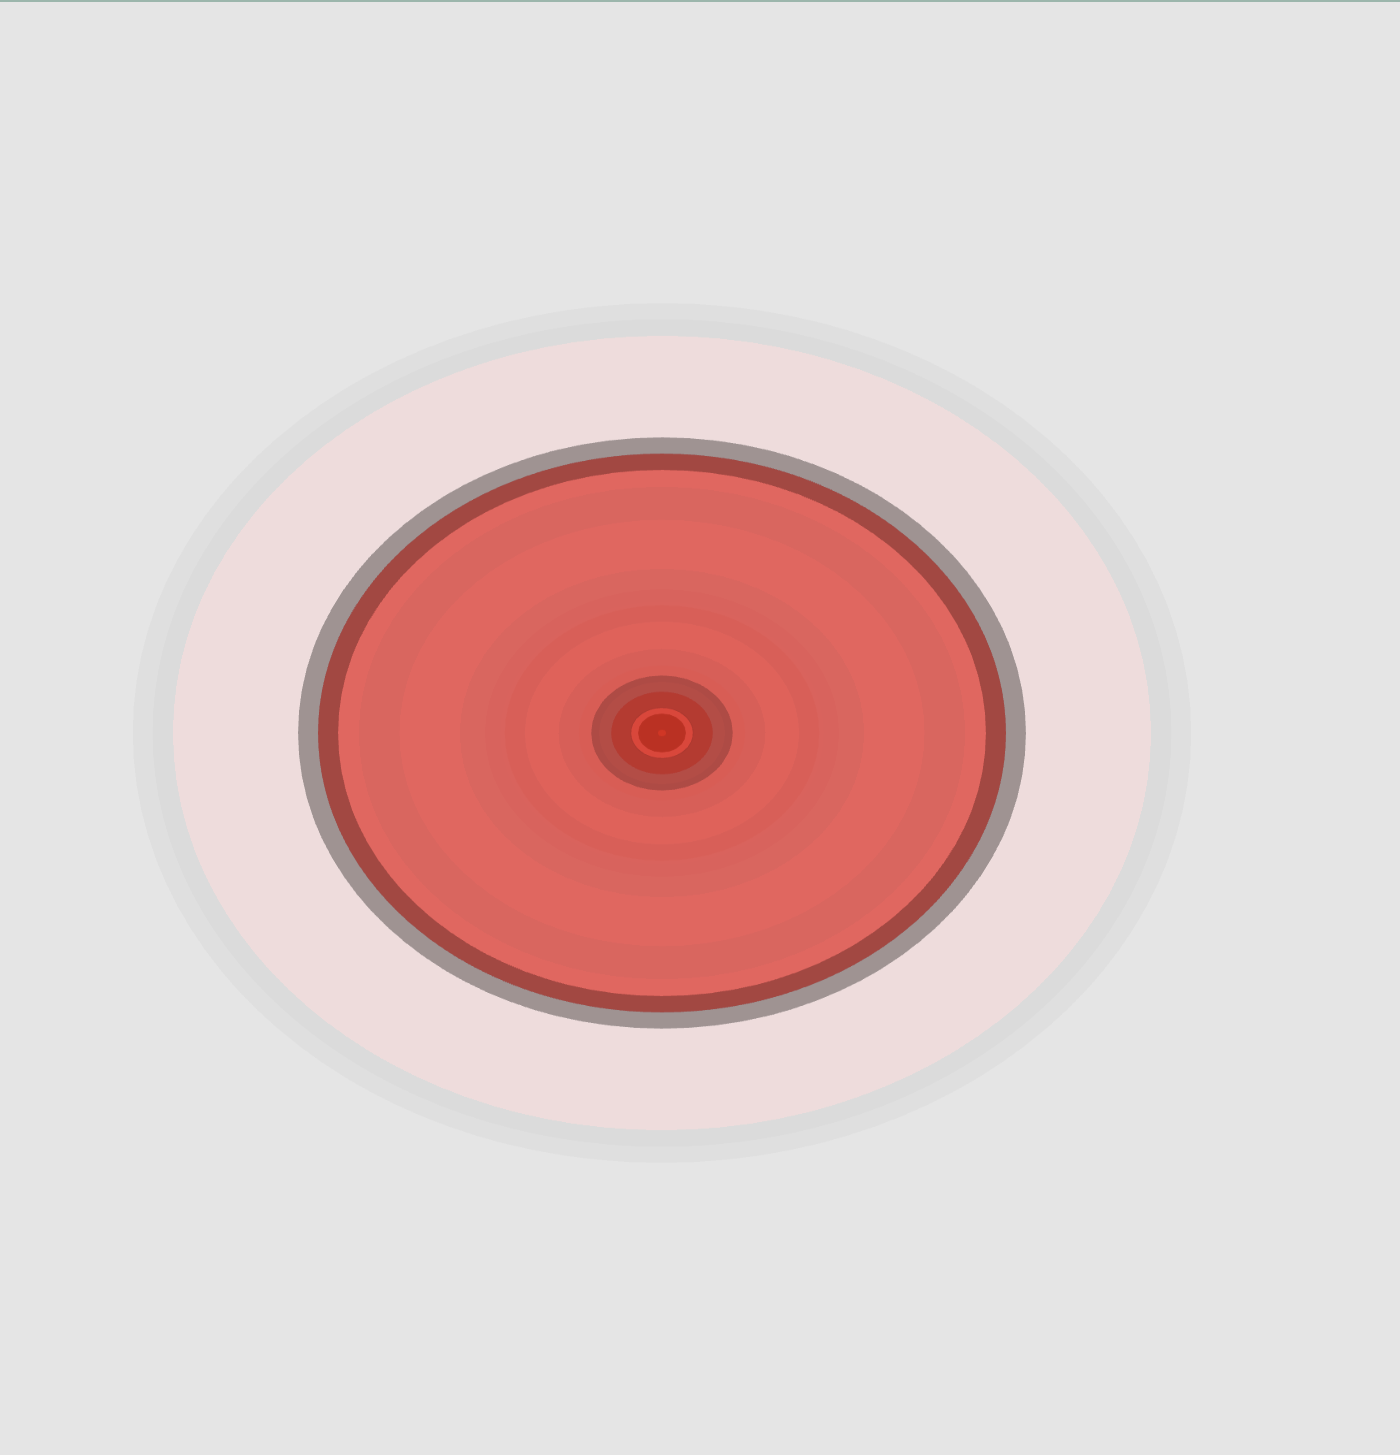
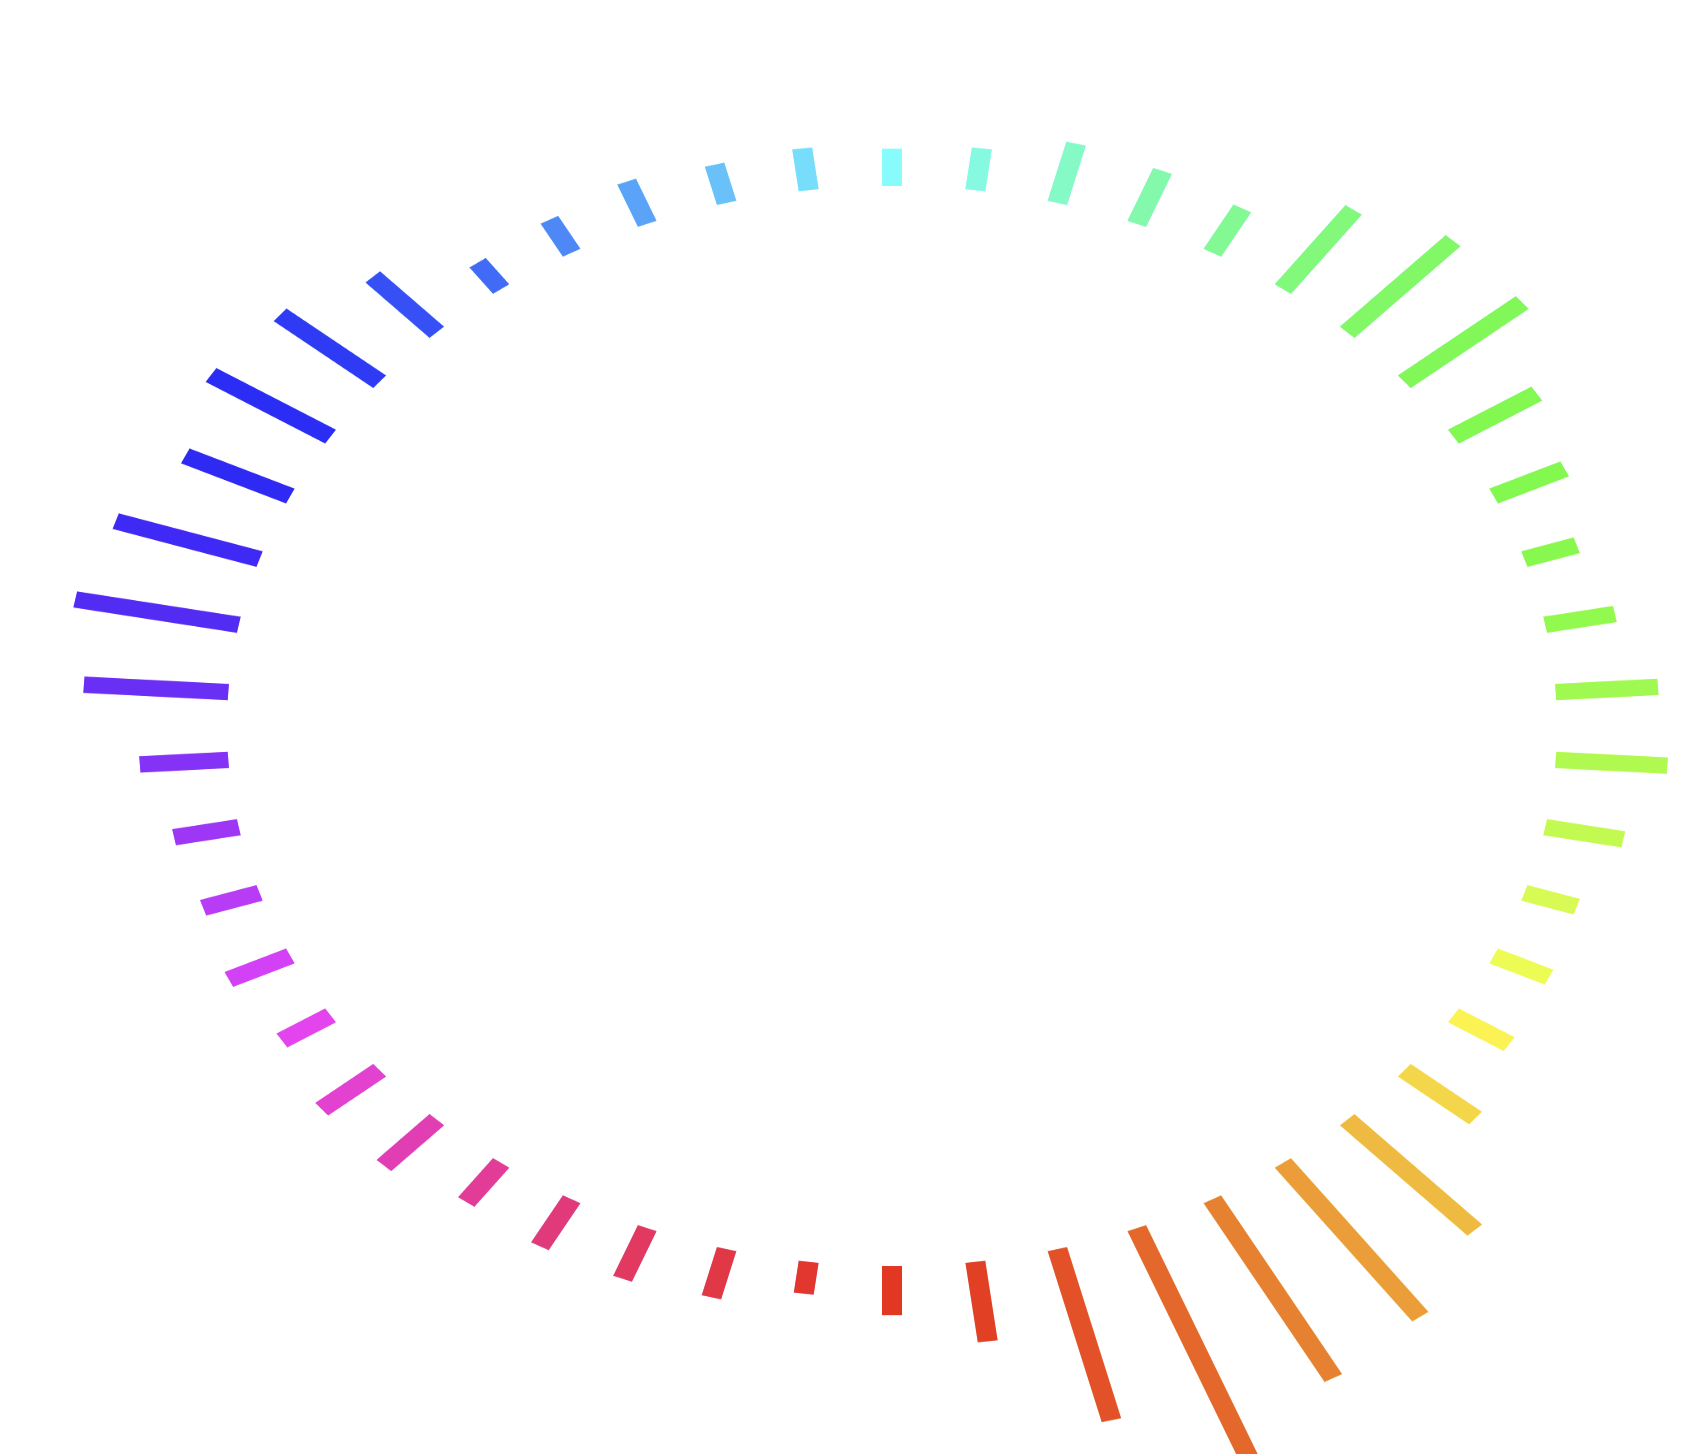
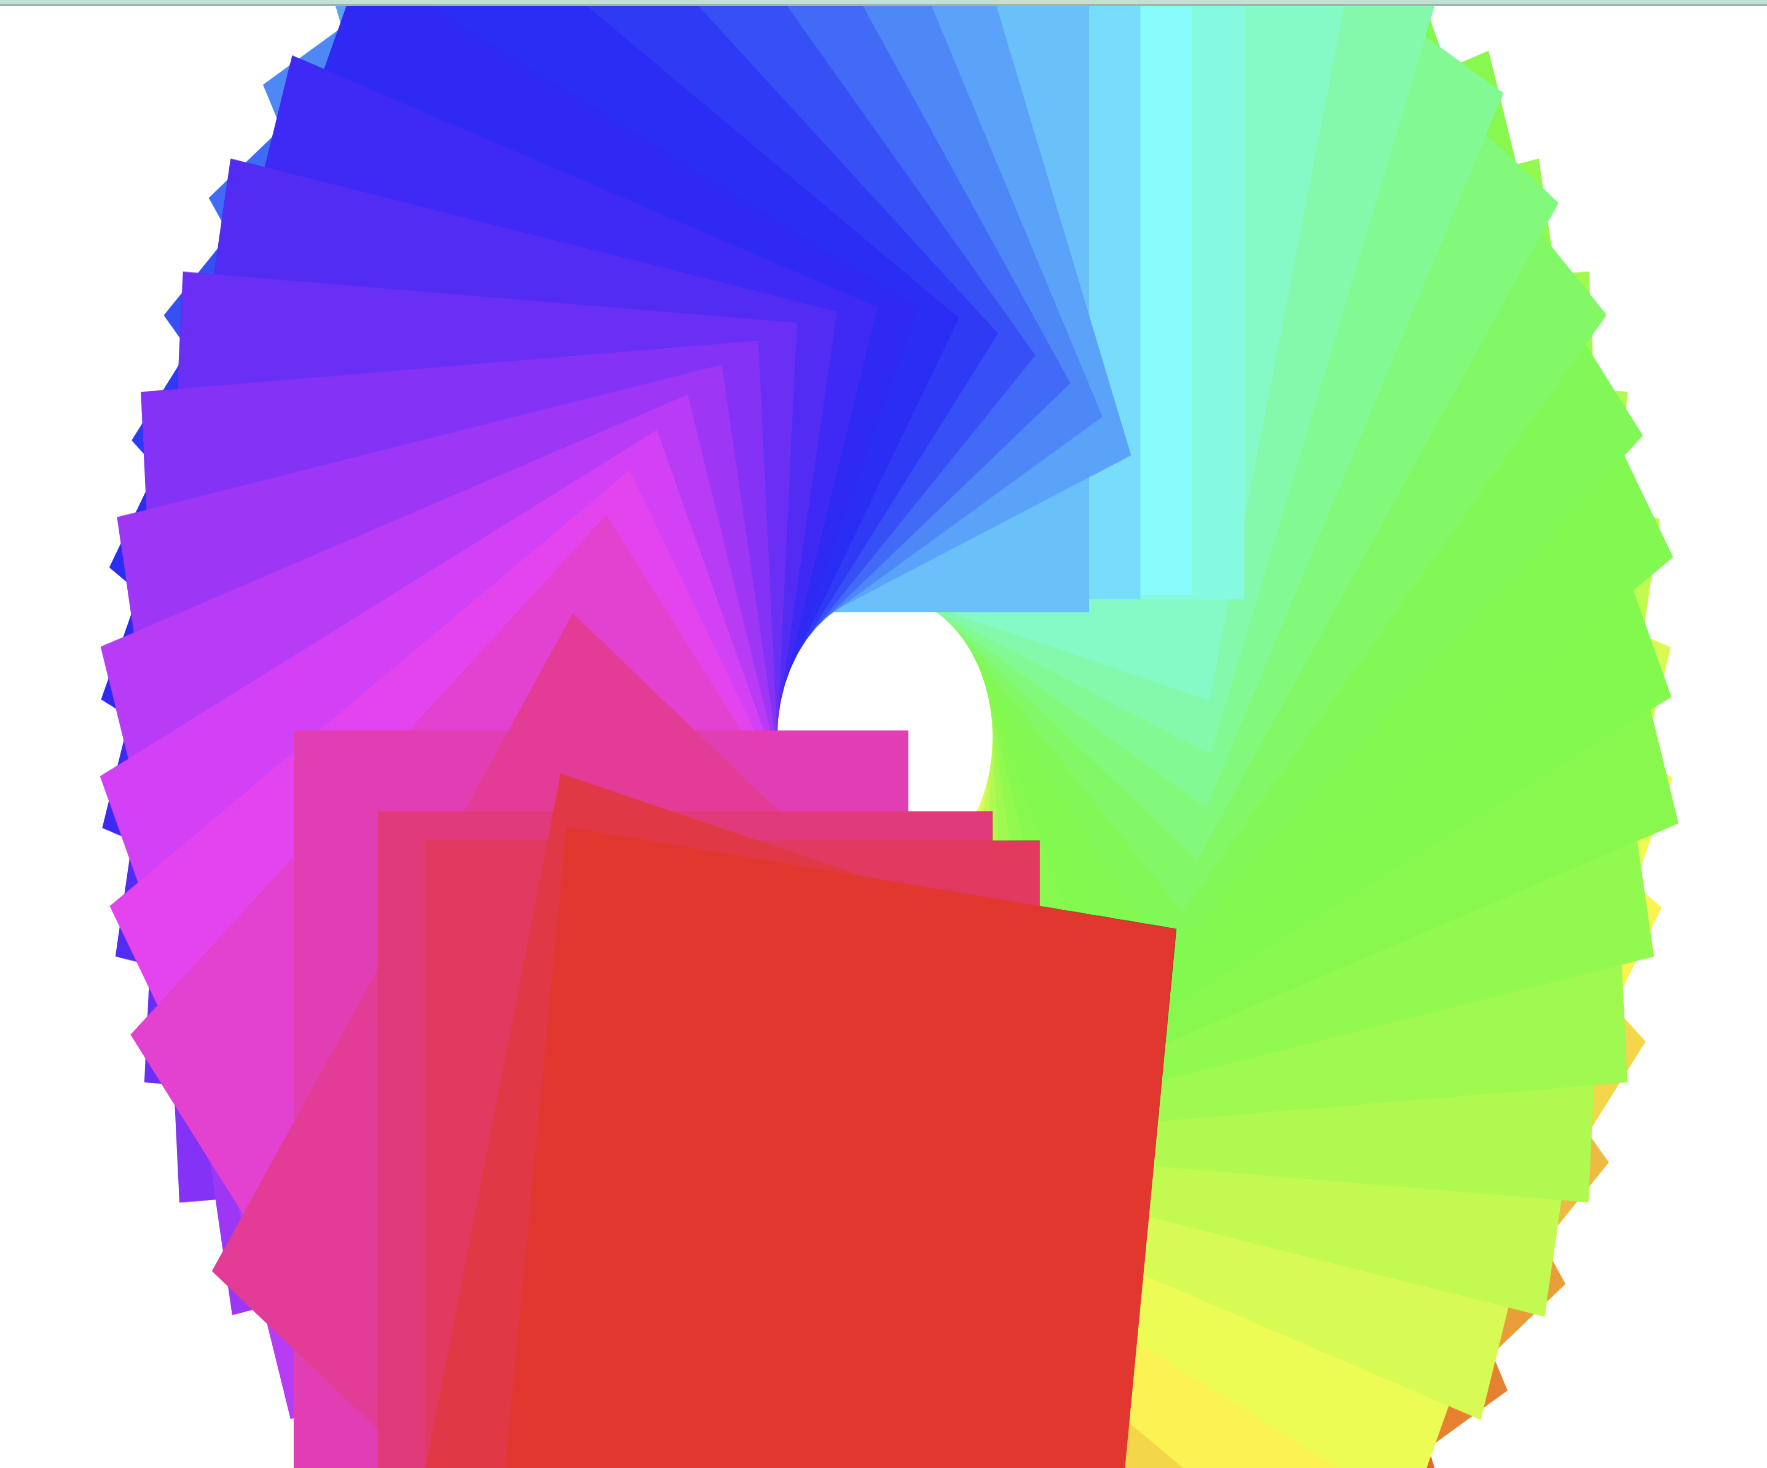
This project explores the relationship between sound and visual form. Using p5.js, audio amplitude is translated into coloured geometric shapes that grow, move, and leave outlines on the canvas. Inspired by synesthesia and chromesthesia, the system allows users to generate unique abstract compositions through sound interaction.
Activity 1


Activity 2
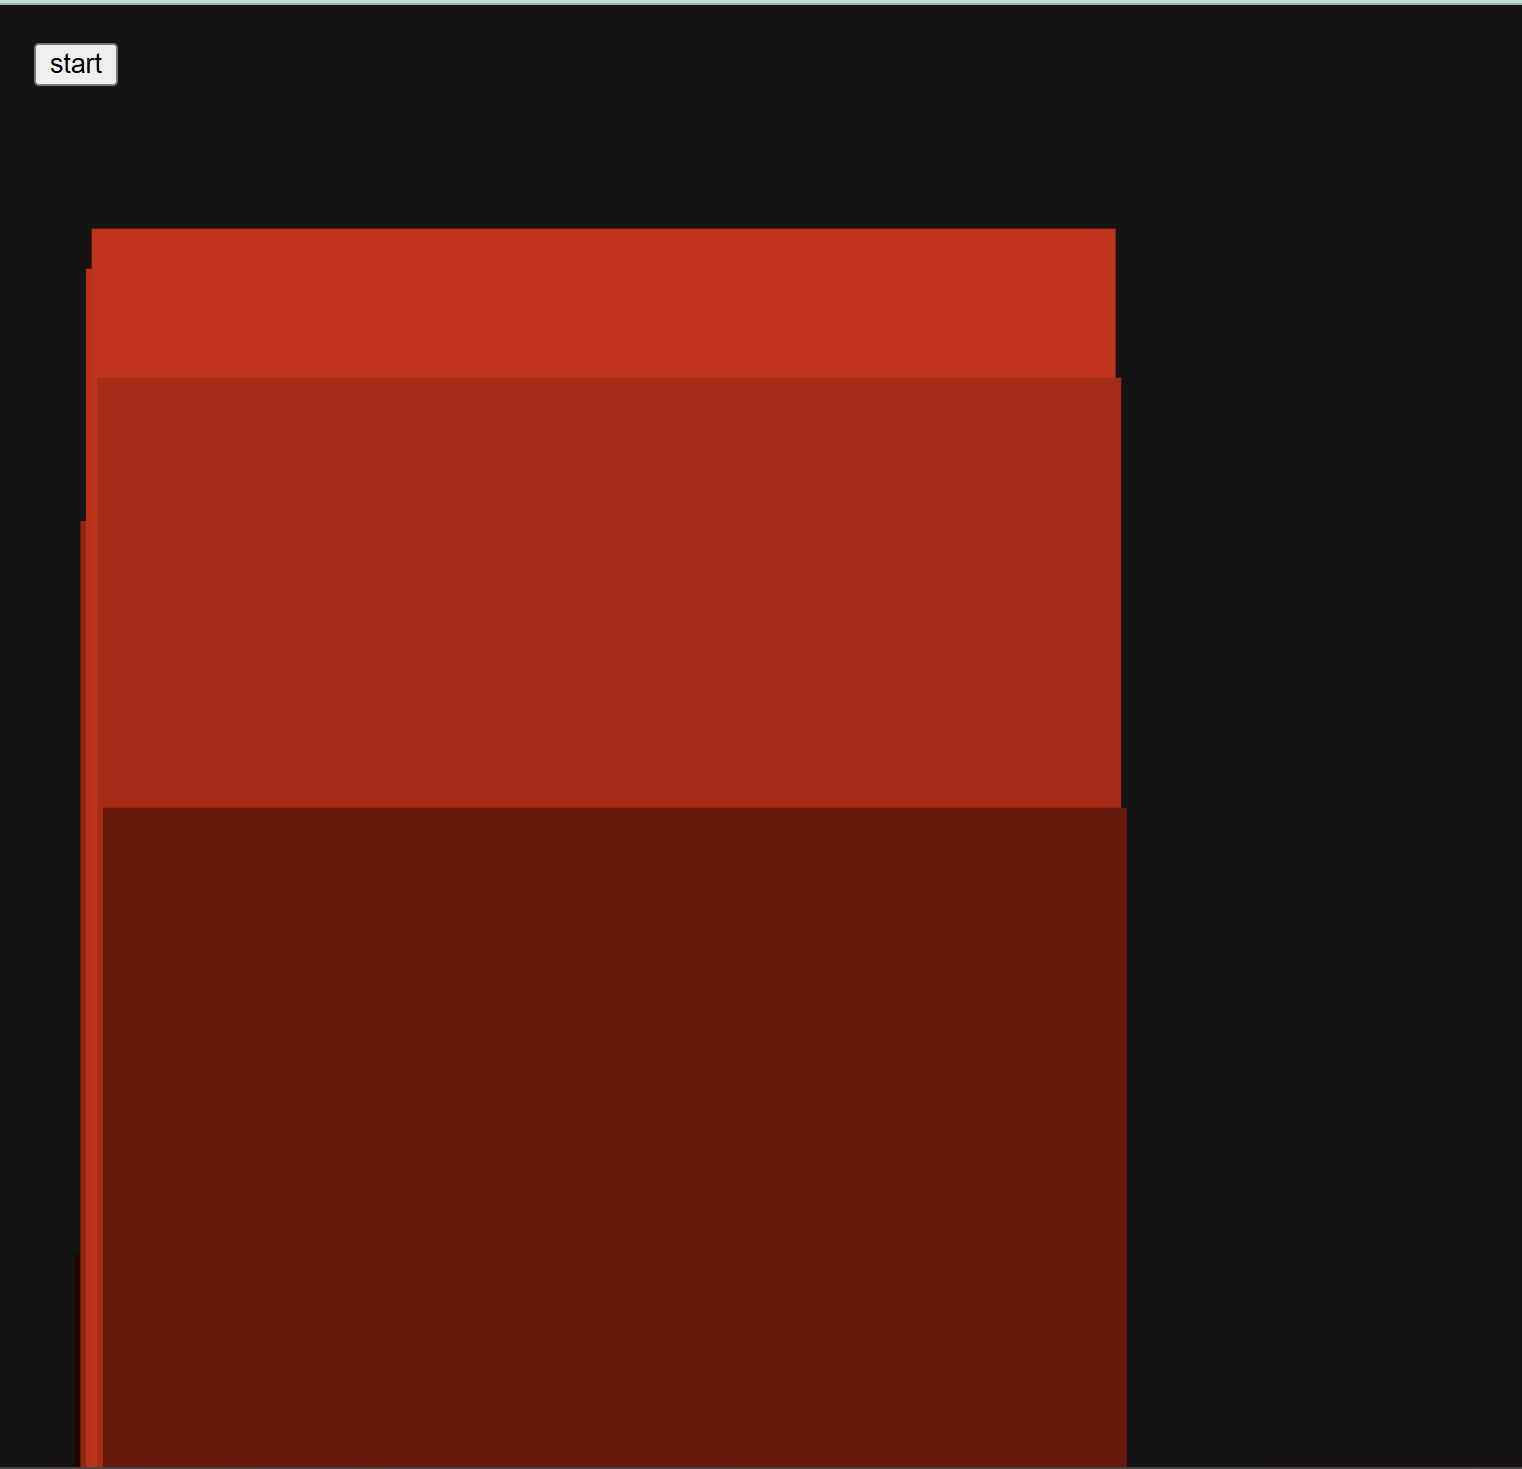
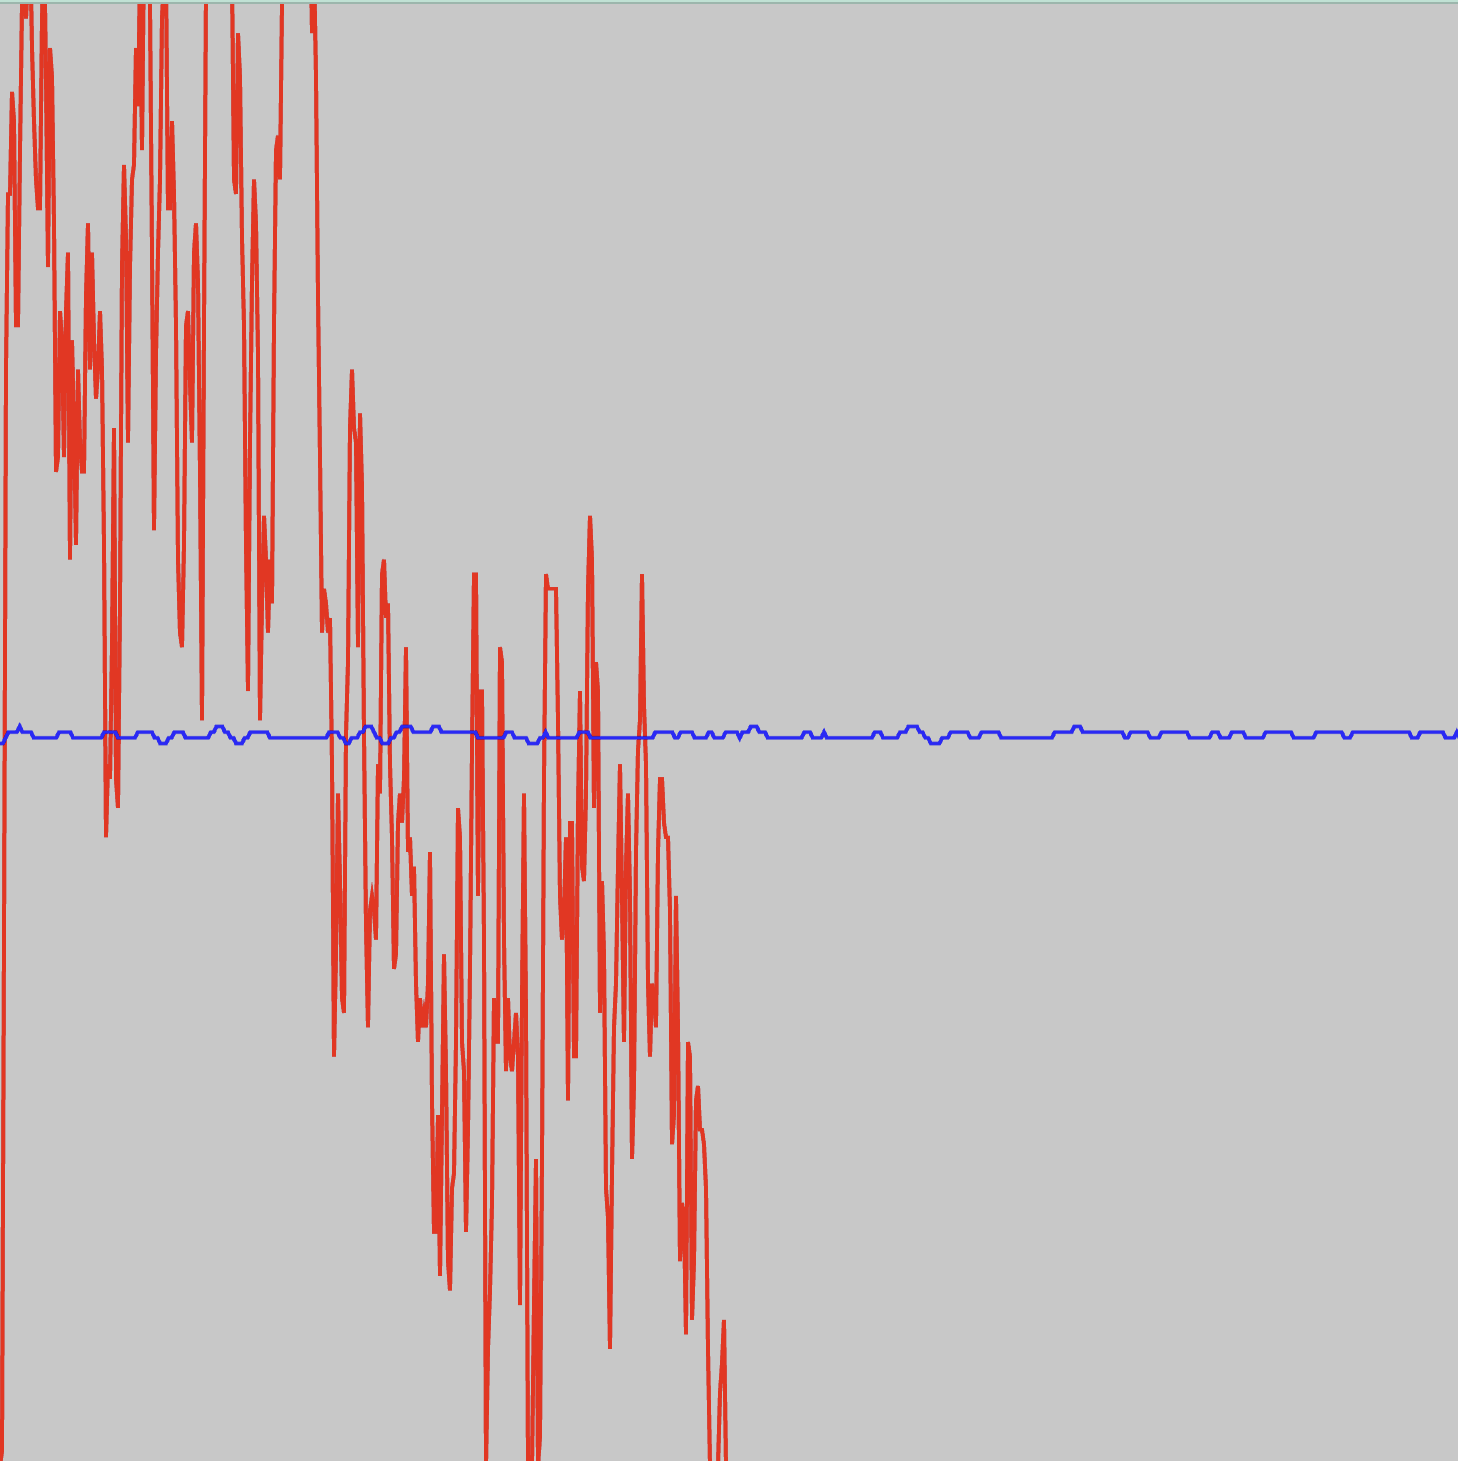
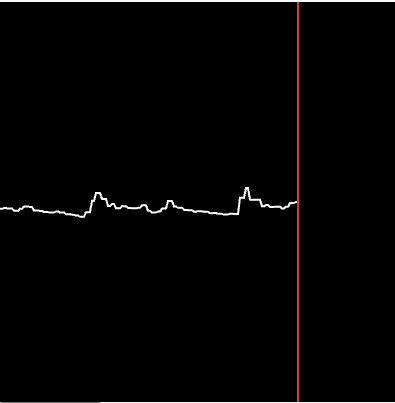
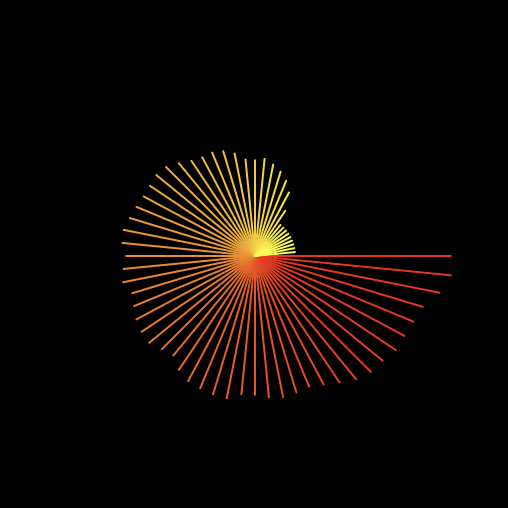
![Changed to let h = map(spectrum[i], 64, 130, 109, height); <br> rect(x, height, spectrum.length / 20, +h);](images/Activity2/Sound_Synthesis_2.png)
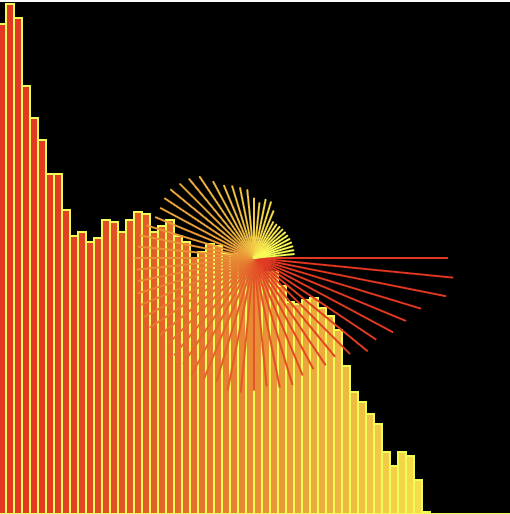
![Changed to let x = map(i, 0, spectrum.length / 200, 0, width); <br> let h = map(spectrum[i], 64, 130, 109, height); <br> rect(x, height, spectrum.length / 20, +h);](images/Activity2/Sound_Synthesis_3.png)
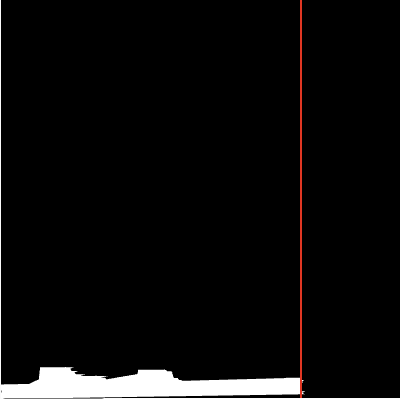
![Changed to let x = map(i, 0, spectrum.length / 200, 0, width); <br> let h = map(spectrum[i], 64, 130, 109, height); <br> rect(x, height, spectrum.length / 20, -h);](images/Activity2/Sound_Synthesis_4.png)
![Changed to let h = map(spectrum[i], 255, 0, 255, height);](images/Activity2/Sound_Synthesis_5.png)


Project 2
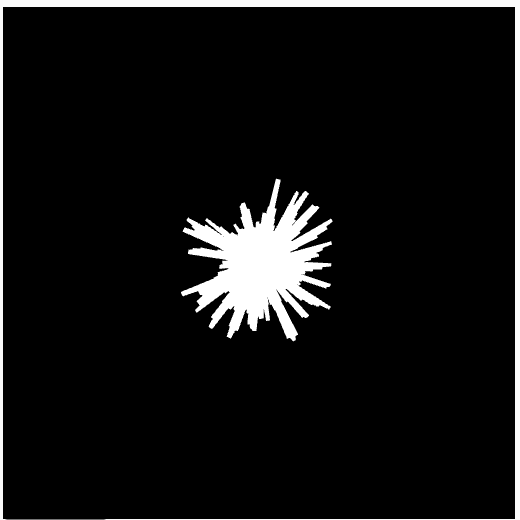
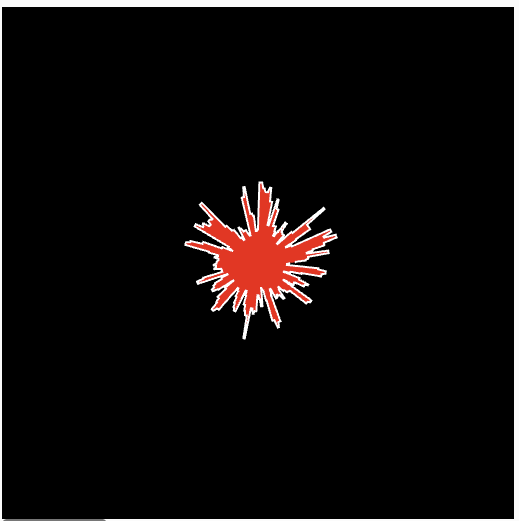
Final Project 2 Design
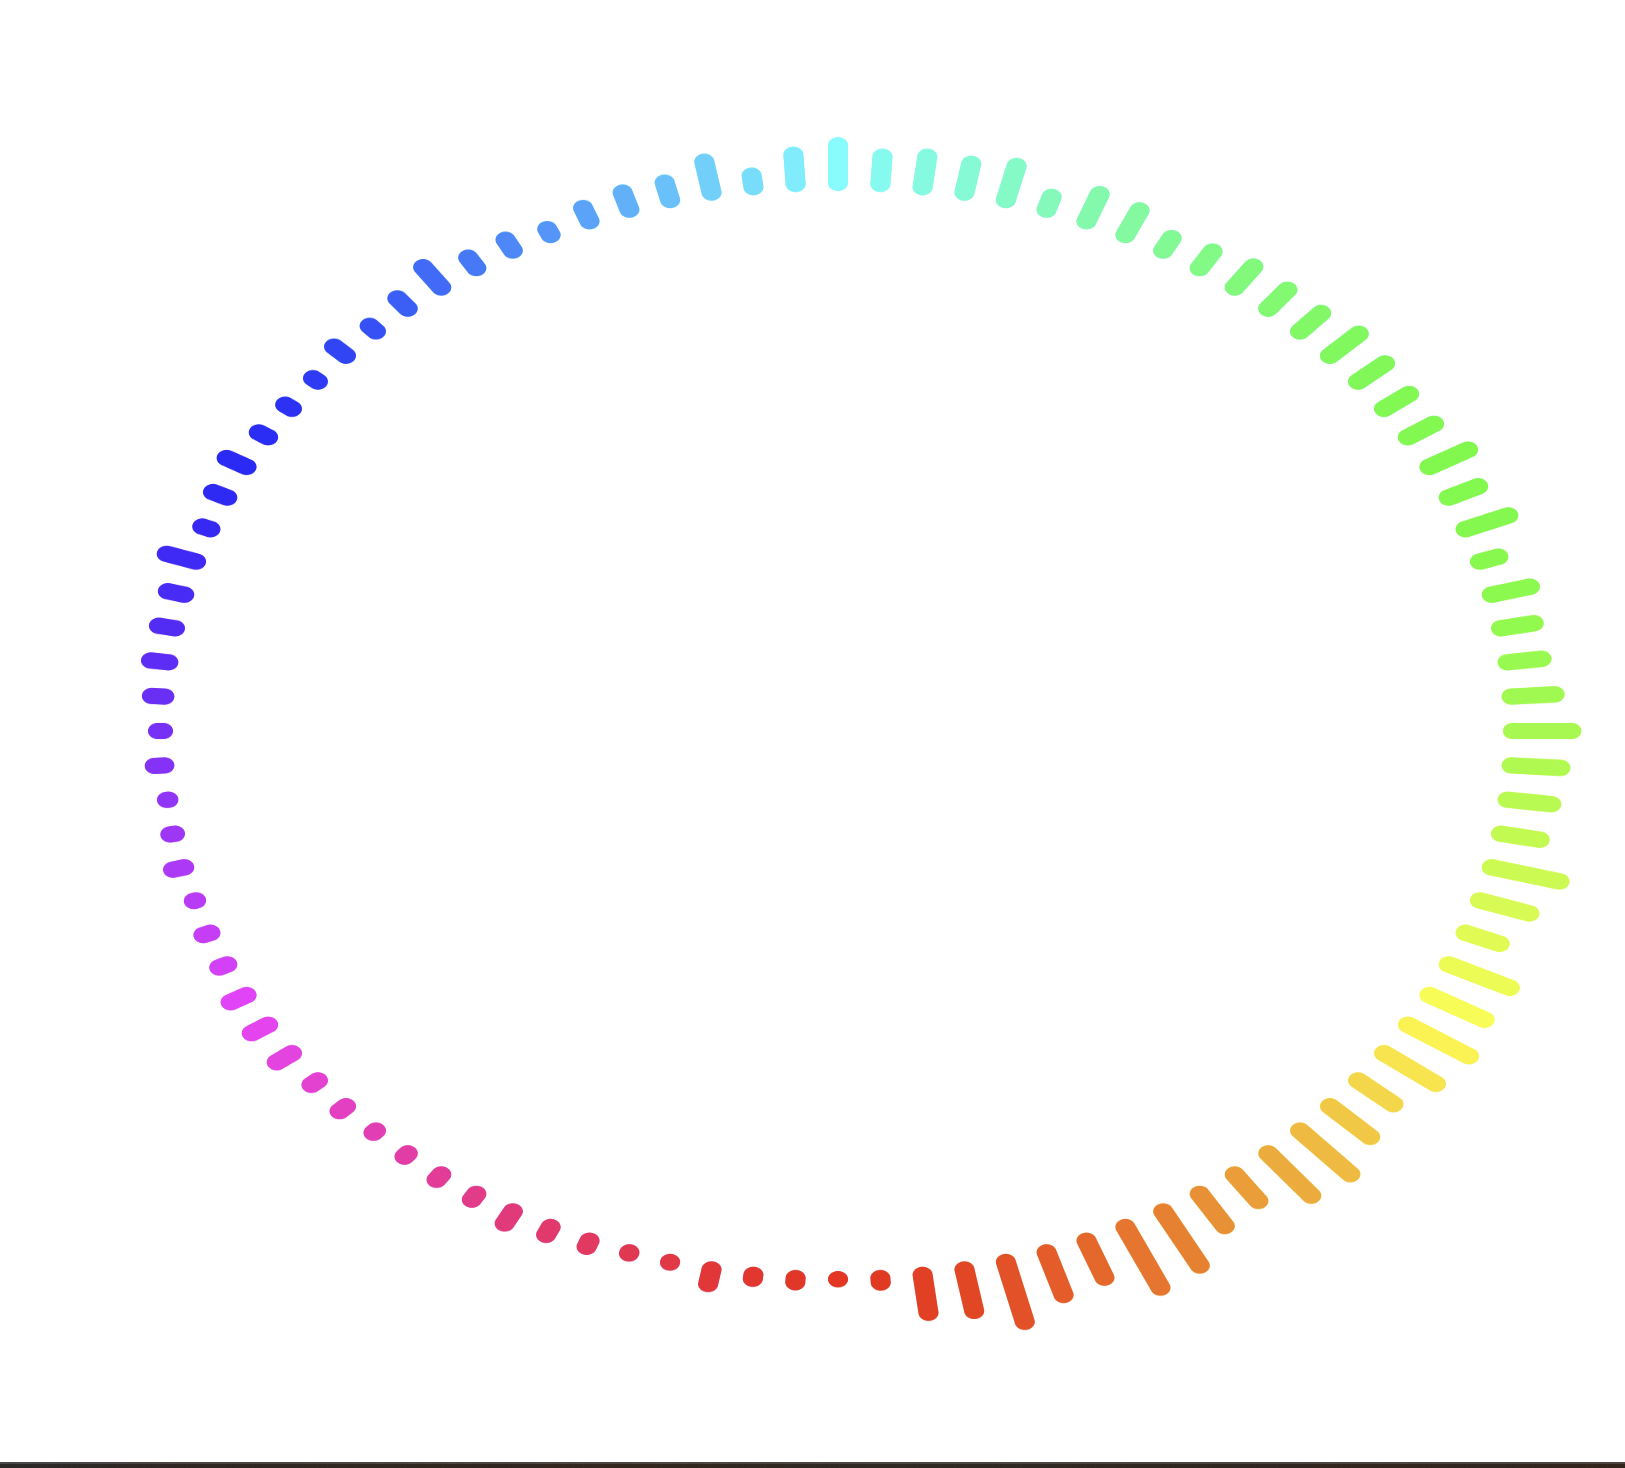
P5 Interactive Audio Web Header Portfolio
Inspired by synesthesia and chromesthesia, each sound generates a coloured geometric shape that grows and moves based on the audio’s amplitude. As the shapes fade, they leave outlines behind, allowing users to create a layered abstract artwork through sound.
Powered by w3.css